Difference between revisions of "MOHID QGIS"
From MohidWiki
RuiCorreia (talk | contribs) (→MOHID plugin installation) |
RuiCorreia (talk | contribs) (→Windows 10) |
||
| Line 39: | Line 39: | ||
QGIS should now be running with the MOHID plugin. | QGIS should now be running with the MOHID plugin. | ||
| − | If the plugin is not visible in the navigation bar, it can be activated through the '''Plugins''' menu, '''Plugins> Manage and Install Plugins...'''. Find the '''MOHID''' plugin under '''Installed''' and check its box. | + | If the plugin is not visible in the navigation bar, it can be activated through the '''Plugins''' menu, '''Plugins > Manage and Install Plugins...'''. Find the '''MOHID''' plugin under '''Installed''' and check its box. |
= For Users = | = For Users = | ||
Revision as of 13:58, 16 September 2022
Contents
!!!Under Construction!!!
Quick Introduction
This User Manual focuses on helping professionals replicate any tasks previously done in the MOHID Graphical User Interface using the QGIS platform.
QGIS is a widely used open source Geographic Information System. If you are not familiar with QGIS, you can find the most recent version for your desired work environment on its official download section, you can also find more details about the platform by consulting its documentation. The instructions written in this manual will be using the 3.22 LTR version, so keep in mind that some interface elements may be outdated by the time you’re consulting this manual.
MOHID plugin installation
Current version: v0.4.0-alpha.2
This plugin is currently under development. It has been tested with QGIS 3.16 and 3.22 standalone versions, which support Python 3.7.0+. An alpha version can be downloaded from the git repository here. Note that this repository is private, hence login and access to the repository are likely required.
In the future, the plugin might be available in QGIS plugin repositories. For the time being, it has to be manually installed.
Windows 10
The downloaded zip must be unzipped and the plugin folder mohid_qgis must be copied over to the QGIS plugin directory: C:\Users\{USER}\AppData\Roaming\QGIS\QGIS3\profiles\default\python\plugins, where {USER} corresponds to the current Windows user account.
Note: If the plugins folder under python does not exist, it can be created manually.
Note: AppData is usually a hidden folder.
The plugin folder must be named mohid_qgis.
QGIS for Windows ships with its own python installation, this means if a third-party python module is required it has to be installed in the QGIS python environment and not on the system's.
To install python packages follow the following steps:
Find the "OSGeo4W Shell" that should be in the desktop shortcuts, installed during QGIS setup, and execute it. Then run the following instructions on the shell:
cd C:\Users\{USER}\AppData\Roaming\QGIS\QGIS3\profiles\default\python\plugins\mohid_qgis
where {USER} corresponds to the current Windows user account.
python -m pip install --upgrade pip
python -m pip install -r requirements.txt
QGIS should now be running with the MOHID plugin.
If the plugin is not visible in the navigation bar, it can be activated through the Plugins menu, Plugins > Manage and Install Plugins.... Find the MOHID plugin under Installed and check its box.
For Users
Grid tab
At the moment, only regular grids are fully operational, meaning MOHID grids (.grd) can be created and saved, and existing grids can be loaded and edited.
Filling the form should be self-explanatory. In principle, the grid can only be created when all fields are properly filled.
It is worth noting that you can capture the origin with the mouse pointer directly on the map by pressing the button .
Preview button creates a temporary layer to visualize the grid.
Save button saves the grid to a .grd file
Load loads an existing .grd grid into QGIS (only for visualizing for now).
Note: Either comma (,) or dot (.) should work as decimal separators.
Bathymetry tab
In the first part of this tab, three types of MOHID files can be handled, that are used to generate Createbathymetry (.dat) files:
Grid (.grd), xyz points (.xyz) and land polygons file(.xy).
Pressing the buttons opens the file browser to look for the respective filepaths. These file types can also be loaded for visualization by additionally pressing the load button
.
In the second part of this tab is it possible to load and edit the final MOHID bathymetry files (.dat).
Loading the bathymetry follows the same logic as the other file types above.
Creating a QGIS Project
In order to do whichever task you need in the QGIS environment you’ll need to create a new project or open an already existing one.
You can create a project by opening the Project > New Menu. Alternatively, to open an already existing project, simply open Project > Open Menu and choose the one you wish to open.
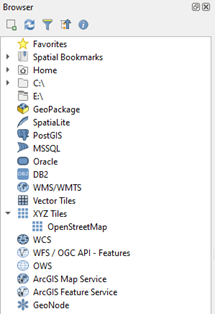
With a project open, you can now add whichever elements you desire. You can start by opening a simple world map by expanding the XYZ Tiles group and selecting OpenStreetMap in the Browser:
MOHID Bathymetry
Visualizing points in MOHID’s .xyz format:
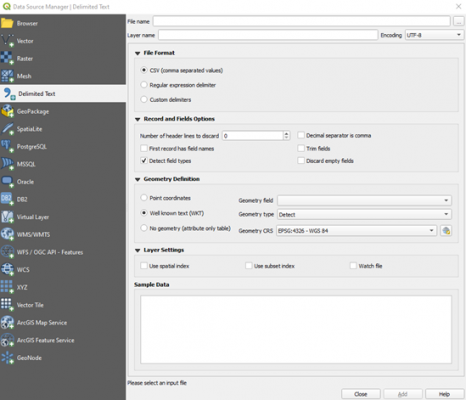
QGIS can easily display point data represented in the MOHID .xyz format, although it is unable to process the header’s option details. To visualize points represented in this format you’ll need to add a new “Delimited Text Layer”. You can do this by opening the Layer > Add Layer > Delimited Text Layer Menu, which will lead you to the following window:
You’ll need to select the Custom delimiters option in the File Format section and check the Space option.
In the Record and Fields Options section, select the number of header lines to discard according to the size of the .xyz file’s option header. Make sure to check the Detect field types option and uncheck the First record has field names and Decimal separator is comma options, since the latter are not present in the MOHID .xyz format.
Finally, you’ll need to check the Point coordinates option in the Geometry Definition section and select field_1, field_2 and field_3 as the x, y and z fields, respectively. Don’t forget to select the Geometry CRS that matches the one specified in the file’s option header.
You’ll now be able to check the table generated by the given data in the Sample Data section and add additional settings in the Layer Settings section.
Visualizing polygon in MOHID’s .xy format:
The first step to visualize a MOHID’s .xy format polygon in QGIS is to convert the polygon file to Shapefile format. A script for converting MOHID's .xy format to shapefile and to WKT is available in the following repository: https://github.com/Flatlightning/mohid-conversions
After downloading the polygonConverter.py script, convert your polygon.xy file to Shapefile format using the folowing command:
python polygonConverter.py -f shp -i polygon.xy
The script will generate three files: polygon.dbf, polygon.shp and polygon.shx.
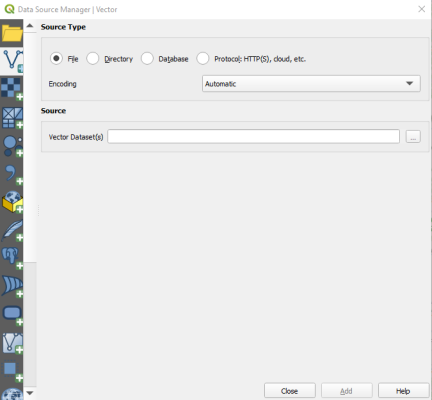
The next step is to add the polygon layer over the OpenStreetMap layer in QGIS. To add the polygon layer, select the Layer > Add Layer > Vector Layer menu, which opens following window:
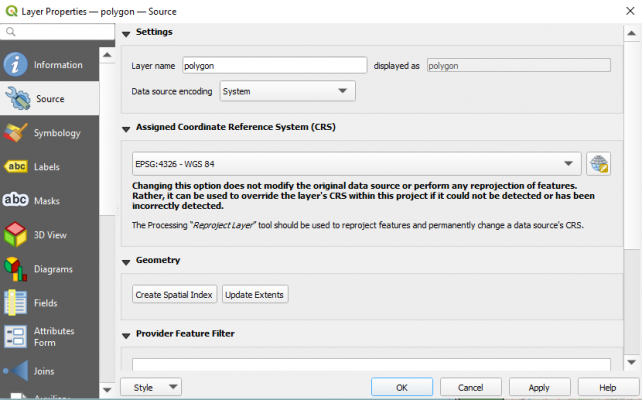
In the Vector Dataset(s) field enter the path to your polygon.dbf file and click Add. Then, double click on the newly created polygon layer in the Layers panel to open the Layer Properties Menu and select the Source tab:
Finally, select the EPSG:4326 - WGS 84 option on the Assigned Coordinate Reference System (CRS) field and click on the Apply button.
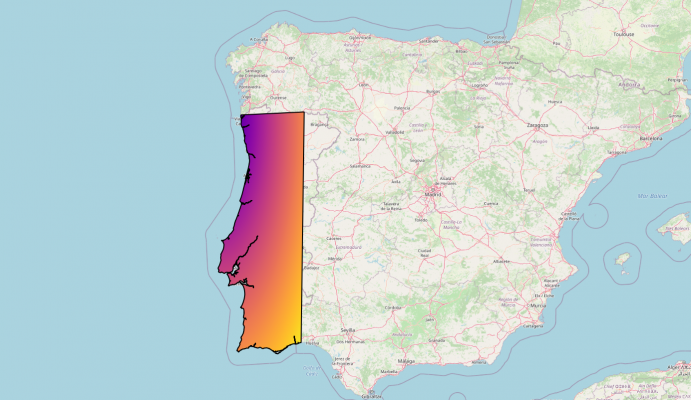
You should now visualize the polygon over the map, e.g.:
For Developers
This section is aimed at contributors.
Plugin structure
For ease of development, the plugin is divided in two main directories, core and plugin:
mohid_qgis/
  core/
  plugin/
The plugin directory will hold the plugin itself, with the UI elements and everything related to their interface logic.
The core directory will hold additional tools such as utilities, algorithms, conversion scripts, etc...
User Interface
QGIS uses .ui files to represent an UI and a .py file to hold the logic of the UI (button actions, etc).
The UI is based on a QDockWidget with an empty QTabWidget. Individual tabs are added on top. This allows the individual development and isolation of each tab which allows for an organized scaling of the plugin. Each tab will then consist of at least a .ui and a .py files. The plugin/tab_bathymetry directory holds the bathymetry tab code and can be consulted for reference.
Add new tab
To add a new tab, one must first create the respective UI interface. The best way of doing this is to use QT Designer, which should come with the QGIS installation. This will generate a .ui file that is used by QGIS to render the UI. This can also be done manually by writing every UI element and its attributes into a .ui file. However, this approach is not recommended as it takes more time and is prone to errors.
Report a bug
If you find a bug, or would like to suggest a new feature, please open an issue on GitHub.
