MOHID QGIS
From MohidWiki
Contents
!!!Under Construction!!!
Quick Introduction
This User Manual focuses on helping professionals replicate any tasks previously done in the MOHID Graphical User Interface using the QGIS platform.
QGIS is a widely used open source Geographic Information System. If you are not familiar with QGIS, you can find the most recent version for your desired work environment on its official download section, you can also find more details about the platform by consulting its documentation. The instructions written in this manual will be using the 3.16 LTR version, so keep in mind that some interface elements may be outdated by the time you’re consulting this manual.
Creating a QGIS Project
In order to do whichever task you need in the QGIS environment you’ll need to create a new project or open an already existing one.
You can create a project by opening the Project > New Menu. Alternatively, to open an already existing project, simply open Project > Open Menu and choose the one you wish to open.
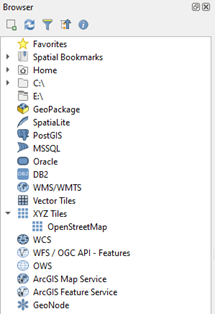
With a project open, you can now add whichever elements you desire. You can start by opening a simple world map by expanding the XYZ Tiles group and selecting OpenStreetMap in the Browser:
MOHID Barimetry
Visualizing points in MOHID’s .xyz format:
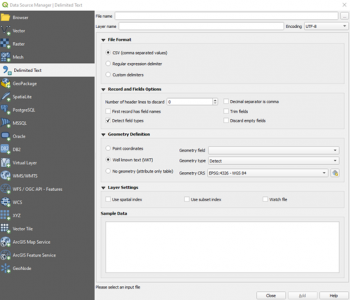
QGIS can easily display point data represented in the MOHID .xyz format, although it is unable to process the header’s option details. To visualize points represented in this format you’ll need to add a new “Delimited Text Layer”. You can do this by opening the Layer > Add Layer > Delimited Text Layer Menu, which will lead you to the following window:
You’ll need to select the Custom delimiters option in the File Format section and check the Space option.
In the Record and Fields Options section, select the number of header lines to discard according to the size of the .xyz file’s option header. Make sure to check the Detect field types option and uncheck the First record has field names and Decimal separator is comma options, since the latter are not present in the MOHID .xyz format.
Finally, you’ll need to check the Point coordinates option in the Geometry Definition section and select field_1, field_2 and field_3 as the x, y and z fields, respectively. Don’t forget to select the Geometry CRS that matches the one specified in the file’s option header.
You’ll now be able to check the table generated by the given data in the Sample Data section and add additional settings in the Layer Settings section.
Visualizing polygon in MOHID’s .xy format:
The first step to visualize a MOHID’s .xy format polygon in QGIS is to convert the polygon file to Shapefile format. A script for converting MOHID's .xy format to shapefile and to WKT is available in the following repository: https://github.com/Flatlightning/mohid-conversions
After downloading the polygonConverter.py script, convert your polygon.xy file to Shapefile format using the folowing command:
python polygonConverter.py -f shp -i polygon.xy
The script will generate three files: polygon.dbf, polygon.shp and polygon.shx.
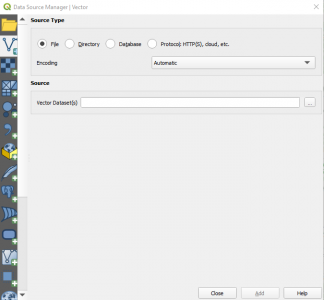
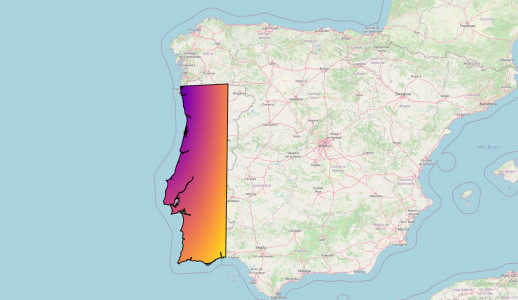
The next step is to add the polygon layer over the OpenStreetMap layer in QGIS. To add the polygon layer, select the Layer > Add Layer > Vector Layer menu, which opens following window:
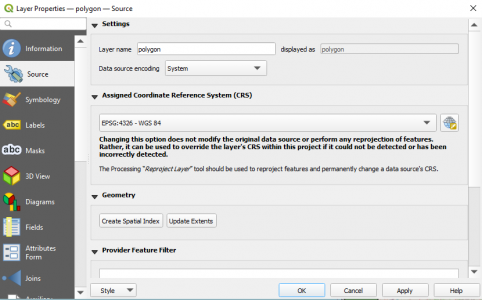
In the Vector Dataset(s) field enter the path to your polygon.dbf file and click Add. Then, double click on the newly created polygon layer in the Layers panel to open the Layer Properties Menu and select the Source tab:
Finally, select the EPSG:4326 - WGS 84 option on the Assigned Coordinate Reference System (CRS) field and click on the Apply button.
You should now visualize the polygon over the map, e.g.:
