Difference between revisions of "Lagged correlation"
From MohidWiki
(→Matlab functions) |
|||
| (2 intermediate revisions by the same user not shown) | |||
| Line 1: | Line 1: | ||
| − | [[Convolution]] or [[cross-correlation]] are similar operands that can be applied to any square-integrable real functions < | + | [[Convolution]] or [[cross-correlation]] are similar operands that can be applied to any square-integrable real functions <math>f</math> and <math>g</math>. |
==Convolution== | ==Convolution== | ||
| − | : < | + | : <math> \left( f \, * \, g \right)(\tau) \equiv \int_{-\infty}^{\infty} f(t) \, g(\tau-t) \,dt </math>. |
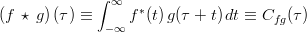
==Cross-correlation== | ==Cross-correlation== | ||
| − | : < | + | : <math> \left( f \, \star \, g \right)(\tau) \equiv \int_{-\infty}^{\infty} f^{*}(t) \, g(\tau+t) \,dt \equiv C_{fg}(\tau)</math>. |
| − | : In particular < | + | : In particular <math> f \, \star \, f </math> is designated the [http://mathworld.wolfram.com/Autocorrelation.html autocorrelation]. |
===Normalized=== | ===Normalized=== | ||
| − | : < | + | : <math>\widehat{C}_{fg}(\tau) \equiv \frac{\int_{-\infty}^{\infty} F^{*}(t) \, G(\tau+t) \,dt}{\int_{-\infty}^{\infty} F^{*}(t) \, F(t) \,dt \, \int_{-\infty}^{\infty} G^{*}(t) \, G(t) \,dt} = \left< \frac{F(t)}{\|F\|} ,\, \frac{G(\tau+t)}{\|G\|} \right></math>, where <math> F \equiv f - \overline{f} </math>. The idea is to remove the average and, optionally, other linear or physical trends from <math> f </math>. |
: In particular we have | : In particular we have | ||
| − | : < | + | : <math>\widehat{C}_{fg}(0) = \left< \frac{F}{\|F\|} ,\, \frac{G}{\|G\|} \right></math>. |
| − | : < | + | : <math>\widehat{C}_{ff}(0) = 1 </math>. |
===Discretized=== | ===Discretized=== | ||
| − | : < | + | : <math>\widehat{C}_{fg}(k) \equiv \frac{1}{n-1} \sum_{i} \frac{ \left( f_i - \overline{f} \right)^{*} \left( g_{k+i} - \overline{g} \right) }{\sigma_f \sigma_g} </math>, where <math>\sigma_f</math> is the variance of <math>f</math>. |
| − | : In particular < | + | : In particular <math> \widehat{C}_{fg}(0) </math> is the famous [http://en.wikipedia.org/wiki/Correlation correlation] coefficient. |
==Example== | ==Example== | ||
| − | When both < | + | When both <math>f</math> and <math>g</math> are [http://en.wikipedia.org/wiki/Even_and_odd_functions even] functions then the [[convolution]] and [[cross-correlation]] products are rigorously equivalent. Below, we show these products when applied to box functions (left figure) and to gaussian functions (right figure). In both cases, they are [http://en.wikipedia.org/wiki/Even_and_odd_functions even] functions. <math>f</math> is represented by the red line, <math>g</math> is represented by the blue line, the product <math>f(t) \, g(\tau - t)</math> is represented by the solid blue line. The solid blue area is the convolution product for lag-time <math>\tau</math> and the whole convolution product function (for all <math>\tau</math>) is represented by the green line. |
http://mathworld.wolfram.com/images/gifs/convrect.gif http://mathworld.wolfram.com/images/gifs/convgaus.gif | http://mathworld.wolfram.com/images/gifs/convrect.gif http://mathworld.wolfram.com/images/gifs/convgaus.gif | ||
| − | The big conclusions we can make is that if < | + | The big conclusions we can make is that if <math>f</math> and <math>g</math> are the same functions, but with a lag of <math>\epsilon</math> between them, then the [[cross-correlation]] product is maximum when <math>\tau = \epsilon</math>. |
==Matlab functions== | ==Matlab functions== | ||
| Line 47: | Line 47: | ||
===cpsd=== | ===cpsd=== | ||
| − | Calculates the cross power spectral density (PSD) function of signals < | + | Calculates the cross power spectral density (PSD) function of signals <math> x(t)</math> and <math> y(t)</math>. |
===periodogram or pwelch=== | ===periodogram or pwelch=== | ||
| − | Calculates the power spectral density (PSD) function of signal < | + | Calculates the power spectral density (PSD) function of signal <math> x(t)</math>. The [[#periodogram|periodogram]] may use several window functions as option. The [[#pwelch|pwelch]] will use the welch window. |
===mscoherence=== | ===mscoherence=== | ||
Latest revision as of 11:26, 8 March 2012
Convolution or cross-correlation are similar operands that can be applied to any square-integrable real functions  and
and  .
.
Contents
Convolution
-
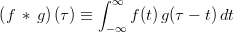 .
.
Cross-correlation
-
 .
.
- In particular
 is designated the autocorrelation.
Normalized
- Failed to parse (unknown error): \widehat{C}_{fg}(\tau) \equiv \frac{\int_{-\infty}^{\infty} F^{*}(t) \, G(\tau+t) \,dt}{\int_{-\infty}^{\infty} F^{*}(t) \, F(t) \,dt \, \int_{-\infty}^{\infty} G^{*}(t) \, G(t) \,dt} = \left< \frac{F(t)}{\|F\|} ,\, \frac{G(\tau+t)}{\|G\|} \right>
, where
 . The idea is to remove the average and, optionally, other linear or physical trends from .
- In particular we have
- Failed to parse (unknown error): \widehat{C}_{fg}(0) = \left< \frac{F}{\|F\|} ,\, \frac{G}{\|G\|} \right> .
-
 .
.
Discretized
-
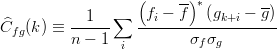 , where
  is the variance of .
- In particular
 is the famous correlation coefficient.
Example
When both and are even functions then the convolution and cross-correlation products are rigorously equivalent. Below, we show these products when applied to box functions (left figure) and to gaussian functions (right figure). In both cases, they are even functions. is represented by the red line, is represented by the blue line, the product  is represented by the solid blue line. The solid blue area is the convolution product for lag-time
  and the whole convolution product function (for all ) is represented by the green line.
http://mathworld.wolfram.com/images/gifs/convrect.gif http://mathworld.wolfram.com/images/gifs/convgaus.gif
The big conclusions we can make is that if and are the same functions, but with a lag of  between them, then the cross-correlation product is maximum when
  .
.
Matlab functions
xcorr
Calculates the cross correlation from two signals.
%Consider arrays t, y1(t), y2(t)
N=length(t);
tlag = linspace(-t(N/2), t(N/2), N+1);
crosscorr = xcorr( y1, y2, N/2, 'coeff');
plot(tlag,crosscorr); xlabel('Phase in time units');ylabel('coefficient');
cpsd
Calculates the cross power spectral density (PSD) function of signals  and
and  .
.
periodogram or pwelch
Calculates the power spectral density (PSD) function of signal . The periodogram may use several window functions as option. The pwelch will use the welch window.
mscoherence
Calculates the coherence-squared spectrum function. If you apply an inverse Fourier transform (IFT), then you get the cross-correlation function in a very efficient way.